Optimizing Elo Parameters for Game Predictions
In the past few weeks, I’ve been optimizing parameters for Elo based predicting of NHL data. The code is complex and won’t be put here. Check the sourcecode in the repo.
I’ve put those results together in a combo plot, built using ggplot and gridExtra to make things better arranged. Check the sourcecode for this post for the details on that.
I evaluated a range of K prime and gamma K values using Log Loss and Brier scoring methods. For both of these methods, lower scores are better.
grid.arrange(mLL6, mLLWD, mLLWOTD, mB6, mBWD, mBWOTD, bLL, bB, pR, ncol=3, nrow=3)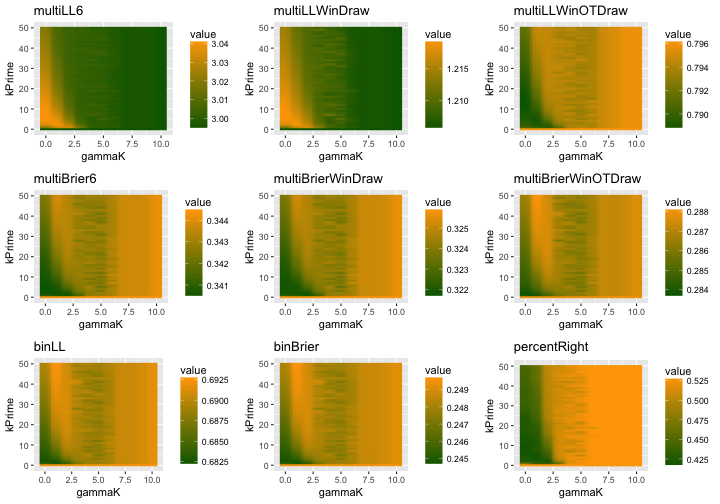
How good is this? Not super good.
The first row of results are complex multi-possibility LogLoss situations. These are hard to give a ‘coinflip’ expected score to, but they correllate with a ‘6 scenario’ correct (predicting chances of Win, OTWin, SOWin, SOLoss, OTLoss, and Loss). Similarly, the predictions for Win/Loss/Draw and Win/OTWin/’Draw’/OTLoss/Loss combine aspects of the randomness of OT or SO games. All of the predictions for each are based on combinations of their own results, so OT wins are included in determining the win chance for binary case, but not for the ‘6 scenario’ case.
Similarly, the second row are the same scenarios calculated for Brier score.
The last row are the scenarios pared down to predictions of win/loss. Log loss of any given game when you predict it to go 50/50 is, using the MLmetrics package, MLmetrics::LogLoss(0.5, 1) == 0.6931472. Similarly, the average coinflip Brier score should result in a score around 0.25. And our ‘percentRight’ should be about 50%. So, we do perform better than that periodically.
Sometimes, though, these things look reversed, such as the better performance of the Percent Right plot at high gammaK and kPrime, but the poorer performance there for all the Brier results. If I can solve that, I’ll update this post.
At the end, though, I don’t see this as being that useful. Being only a few points better at predicting game results than a coinflip is not a selling point. But, maybe the value is in season predicting? I’ll look at some of that in the future.
Update But first, I’ve come to realize that I was overly-complicated in generating predictions for the winning team. Recall that the original ELO formula contains a predictive equation for the home team’s chances $P_home$:
where is the home team ranking, and is the away ranking.
Using this, I’ve re-run the optimization, and achieved the following results:
grid.arrange(loglossplot, brierplot, percentplot, ncol=3, nrow=1)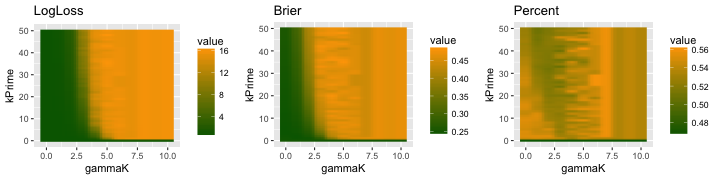
But, after all that, we can look and see that this isn’t really an improvement. Oh well.