Better Season Results Visualizations

Intro

No one likes to hear about their team having a back to back in any sport. With hockey, it’s the same.

Data

We’ll use some of the old scripts for loading and processing the hockey data. We’ll look at the last ten complete years of data (2006-2007 to 2016-2017).

#Load Data
nhl10<-readHockeyData(data_dir = "./_data/", nhl_year_list = c(2007:2017), playoffs = FALSE)
nhl10<-nhl10[nhl10$League == "NHL",]
nhl10<-nhl10[,c(1,2,3,4,5,6,11)]

A nasty set of ifs takes every game, and looks in the past few days to see if the home or away team was playing. If so, it sets the rest to 0 days rest (back to backs) up to 3 days (including > 3 days).

#Finding back to backs, rested, etc.
nhl10$HomeRest <- rep(3)
nhl10$VisitorRest <- rep(3)
 
for (g in seq_len(nrow(nhl10))){
  d<-nhl10[g,1]
  h<-nhl10[g,2]
  v<-nhl10[g,4]
 
  if(h %in% nhl10[nhl10[,1] == d - 1, 2] || h %in% nhl10[nhl10[,1] == d - 1, 4]){
    nhl10[g,8]<-0
  } else if(h %in% nhl10[nhl10[,1] == d - 2, 2] || h %in% nhl10[nhl10[,1] == d - 2, 4]){
    nhl10[g,8]<-1
  } else if(h %in% nhl10[nhl10[,1] == d - 3, 2] || h %in% nhl10[nhl10[,1] == d - 3, 4]){
    nhl10[g,8]<-2
  }
  if(v %in% nhl10[nhl10[,1] == d - 1, 2] || v %in% nhl10[nhl10[,1] == d - 1, 4]){
    nhl10[g,9]<-0
  } else if(v %in% nhl10[nhl10[,1] == d - 2, 2] || v %in% nhl10[nhl10[,1] == d - 2, 4]){
    nhl10[g,9]<-1
  } else if(v %in% nhl10[nhl10[,1] == d - 3, 2] || v %in% nhl10[nhl10[,1] == d - 3, 4]){
    nhl10[g,9]<-2
  }
}
 
nhl10$RestDifferent<-nhl10$HomeRest - nhl10$VisitorRest
nhl10$BinResult<-round(nhl10$Result)
nhl10$TriResult<-ifelse((nhl10$Result < 0.9 & nhl10$Result > 0.1), 0.5, nhl10$Result)

Analysis

We can see how the league typically schedules teams with a few quick ggplot graphics.

ggplot(data=nhl10) + 
  geom_histogram(aes(x=HomeRest, ..density..), fill='blue', alpha=0.3, binwidth = 1, center=0) +
  geom_histogram(aes(x=VisitorRest, ..density..), fill='red', alpha=0.3, binwidth = 1, center = 0) +
  ggtitle("Proportion of Days of Rest for Home(Blue) and Away (Red) Teams") + 
  xlab("Days of Rest") + 
  ylab("Proportion of Games") + 
  theme_bw()

plot of chunk restDayCompare

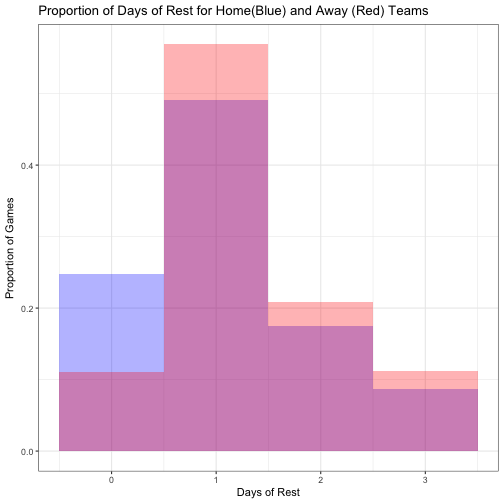
Clearly, the league doesn’t like to schedule back to back games for a team to have the second game on the road, as much as having the second game at home. This is accompanied by a similar reduction in rest days at home for 1-3 days.

Lets also look at the winning percentages for teams in each situation. To start, we’ll note that the total win percent for the home team in the past decade has been 54.65%. For each situation, the table is shown below

m<-matrix(rep(0.5), nrow = 4, ncol = 4)
rownames(m)<-c("Home.0", "Home.1", "Home.2", "Home.3+")
colnames(m)<-c("Visitor.0","Visitor.1","Visitor.2","Visitor.3+")
for(a in seq(1:4)){
  for(b in seq(1:4)){
    r<-mean(nhl10[nhl10$HomeRest == (a-1) & nhl10$VisitorRest == (b-1),"BinResult"])
    m[a,b] <- r
  }
}
pander(m)

  Visitor.0 Visitor.1 Visitor.2 Visitor.3+ ————- ———– ———– ———– ———— Home.0 0.5453 0.5941 0.5865 0.5116

Home.1 0.5435 0.5416 0.5521 0.5262

Home.2 0.4663 0.5281 0.5451 0.484

Home.3+ 0.4304 0.5662 0.559 0.5099

So, it looks like there’s some situations to avoid, such as being at home very rested against a busy visitor team. A win percentage of 43.04% is very low. That’s an interesting finding, but seems to hold some water as it’s happened 79 times in the past 10 years. Actually, none of these cases are infrequent, below is a table of the counts of each case.

m<-matrix(rep(0.5), nrow = 4, ncol = 4)
rownames(m)<-c("Home.0", "Home.1", "Home.2", "Home.3+")
colnames(m)<-c("Visitor.0","Visitor.1","Visitor.2","Visitor.3+")
for(a in seq(1:4)){
  for(b in seq(1:4)){
    r<-length(nhl10[nhl10$HomeRest == (a-1) & nhl10$VisitorRest == (b-1),"BinResult"])
    m[a,b] <- r
  }
}
pander(m)

  Visitor.0 Visitor.1 Visitor.2 Visitor.3+ ————- ———– ———– ———– ———— Home.0 629 1584 578 301

Home.1 506 4119 1065 458

Home.2 178 1032 798 188

Home.3+ 79 385 161 455

The above results look at overtime and shootout results with the same importance as regular wins. If we turn all overtime results into a set of {0, 0.5, 1}, representing home loss, overtime (either team winning), and home win, respectively, then we’ll get the following win chances:

m<-matrix(rep(0.5), nrow = 4, ncol = 4)
rownames(m)<-c("Home.0", "Home.1", "Home.2", "Home.3+")
colnames(m)<-c("Visitor.0","Visitor.1","Visitor.2","Visitor.3+")
for(a in seq(1:4)){
  for(b in seq(1:4)){
    r<-mean(nhl10[nhl10$HomeRest == (a-1) & nhl10$VisitorRest == (b-1),"TriResult"])
    m[a,b] <- r
  }
}
pander(m)

  Visitor.0 Visitor.1 Visitor.2 Visitor.3+ ————- ———– ———– ———– ———— Home.0 0.5644 0.5821 0.5779 0.5133

Home.1 0.5296 0.5426 0.5521 0.5295

Home.2 0.4831 0.5349 0.5476 0.4681

Home.3+ 0.4241 0.5403 0.5342 0.5099

The same effect is shown whether we account for overtime games or not.

Finally, we’ll look at expected goal differential, to see if there’s any insights in goal production by rest difference.

nhl10$GoalDiff <- nhl10$HomeGoals - nhl10$VisitorGoals
nhl10[nhl10$OTStatus != '', ]$GoalDiff <- 0
ggplot(data=nhl10, aes(x=RestDifferent, y=GoalDiff)) + 
  geom_point() +
  geom_smooth(method='lm') +
  ggtitle("Goal differential by Days Rest (+ favours home team)") + 
  xlab("Days of Rest") + 
  ylab("Goal Differential") + 
  theme_bw()

plot of chunk goals

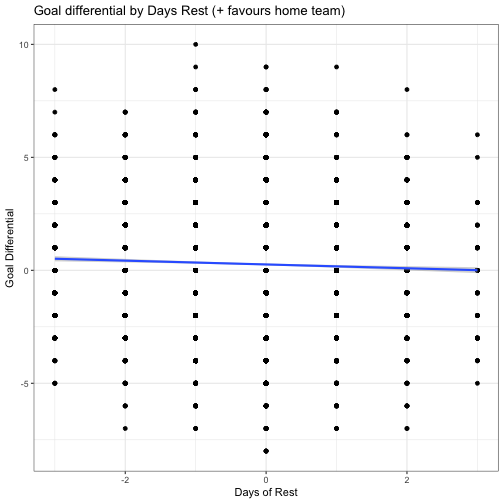
While technically that’s a negative line of best fit, the R^2 value for the fit is only 0.001458, which is functionally useless. Thus, no determination of the goal difference can be drawn from the amount of rest of the teams.

Conclusions

Everyone hates the thought of their favorite team playing back to back games. But, there’s no reason to fear. In fact, the data suggest that longer rests are more detrimental to a team’s performance.

Read More

TensorFlow and R for NLP

Those of you who are interested in machine learning will likely have heard of Google’s TensorFlow. While R is not officially supported, RStudio has developed a wrapper to be able to use TensorFlow in R. More information, and a few tutorials, are available on the website, but I’ll add to that list with some Natural Language Processing (NLP) examples, since they seem to not be overly abundant online.

Read More

TSP in R Part 2

Last time we created a distance matrix and a time matrix for use in TSP problems. We’re using a set of locations in the Ottawa, Ontario, Canada area, but any list of locations with addresses would work. Now we’ll work through getting optimized routes to visit each address once. We’ll optimize by distance, but we also generated a ‘time matrix’ and could run the TSP solver that way.

Read More

TSP in R Part 1

I’ve been playing around recently with some Travelling Salesperson Problems (TSP), and by extension some Vehicle Routing Problems (VRP). For example, when people come to visit Ottawa, are they being the most optimal with visiting a list of sites, that is, spending the least time or distance in their cars travelling between places? If their trip takes more than one day, does that change the order they see things?

Read More

Building Concorde for osX

I’ve been playing around with Travelling Salesperson Problems (TSP) recently. A package for R, TSP, contains most basic solvers, but it doesn’t contain one of the best, Concorde.

Concorde is available as prebuilt binaries for many platforms, but not for osX. For Macs, it has to be downloaded and built from the source. It can be tough to build it on osX, but after much digging I’ve found some instructions. It required the Way Back Machine to dig it out of some archives, so I’m reposting it here for posterity.

Read More

Scoring ELO Over a Season

On Twitter, there are many excellent hockey analytics folks. One in particular, @IneffectiveMath, is worth following. Amongst other things, such as great visualizations of data, he’s running a contest this year that is rating models on their season-long predictions, using the following scoring scheme:

Read More

Scraping Player Data

Hockey-Reference.com is a wonderful tool, with hoards of data to be played with. We’ve used their great site for scraping score data (see this post), but there is a full stats breakdown of every player who has ever played in or been drafted to the NHL on their site as well.

We’ll see this post how to write a scraper to collect that data for future use.

Read More

The Puzzle Of The Lonesome King

From http://fivethirtyeight.com/features/the-puzzle-of-the-lonesome-king/.

A coronation probability puzzle from Charles Steinhardt:

The childless King of Solitaria lives alone in his castle. Overly lonely, the king one day offers one lucky subject the chance to be prince or princess for a day. The loyal subjects leap at the opportunity, having heard tales of the opulent castle and decadent meals that will be lavished upon them. The subjects assemble on the village green, hoping to be chosen.

The winner is chosen through the following game. In the first round, every subject simultaneously chooses a random other subject on the green. (It’s possible, of course, that some subjects will be chosen by more than one other subject.) Everybody chosen is eliminated. (Not killed or anything, just sent back to their hovels.) In each successive round, the subjects who are still in contention simultaneously choose a random remaining subject, and again everybody chosen is eliminated. If there is eventually exactly one subject remaining at the end of a round, he or she wins and heads straight to the castle for f?ting. However, it’s also possible that everybody could be eliminated in the last round, in which case nobody wins and the king remains alone. If the kingdom has a population of 56,000 (not including the king), is it more likely that a prince or princess will be crowned or that nobody will win?

Extra credit: How does the answer change for a kingdom of arbitrary size?

Read More

NHL and Elo Through the Years - Part 3

Having Elo ratings for teams over all time is cool, but how do we know that it’s meaningful? Sure, we can look at the Stanley Cup winning team each year, and see that they typically have a good rating. Or, we can anicdotally look back at our favourite team, remember how good or bad they were for a few seasons in the past, and see that they were near the top or the bottom of the pile at that point in time.

Read More

NHL and Elo Through the Years - Part 1

I’ve developed my own Elo toolset, with options available that I discussed in this earlier post. This includes an adjustment option for home ice advantage, and isn’t pinned down to any specific set of possible results (e.g. able to give overtime wins less of a boost than reguar time wins). Lets take a look at the Elo ratings over all time in the NHL.

Read More

New Elo for NHL

Last time, we looked at Elo ratings for NHL teams. We saw that the more fancy Elo ratings didn’t keep the average constant, that is, ratings were inflated through time. As well, they didn’t take into consideration any summertime normalization, whereby the elo ratings were adjusted towards the mean as is very common in sports Elo. Any other common adjustments, such as placing increased rating on playoff games, aren’t contained therein either. I’ll look into developing a set of those tools, specific to our usages..

Read More

Home Ice Advantage

While working on a new Elo rankings posts, I played around with data to determine a good value for home ice advantage (in terms of winning percentage). That value has changed drastically over the years, and I thought it was interesting, so I’d put it up here.

Read More

Chemistry Intro

Along with playing around with hockey data, my real job is doing chemistry. Sometimes, this blog will contain work from that field, discussing tools I use or have written, papers that I find interesting, or other cool stuff. I say this, because I’ve started working on a few posts that will trickle out slowly interspersed in the hockey. To easily find these types of post, use the Tags feature, and look for ‘chemistry’.

Read More

NHL Elo

Predicting scores (and seasons) by Dixon-Coles is interesting, but it’s one of many ways of doing ‘game-level’ predictions. There’s a family of rating systems called Elo, which was originally developed to rank chess players. There are a number of extensions of Elo, including some modifications to parameters by the World Chess Federation (FIDE), a modification including uncertainty and ‘reliability’ called Glicko, and a more parameterized version of Glicko developed in 2012 called Stephenson. These are all implemented in the PlayerRatings package in R. There’s also an modification of Glicko developed by Microsoft called TrueSkill and this is implemented in the aptly named trueskill package. Note that TrueSkill is a closed licence product, available only for non-commercial implementations.

We’ll compare all of these methods for their historical performance in NHL, as well as (eventually) go into predicting the coming season. TrueSkill has a few oddities, so we’ll look at it later.

Read More

nhlscrapr and Play-By-Play Data

As interesting as it is to predict how well teams will do on a team-by-team basis, based on their past performance, it would be great to get better granularity and be able to dig into what happened each game. This data is available, online, from the NHL website. Manually downloading it all would be horrendous (there are 1230 games each year, plus playoffs). Fortunately, a package exists in CRAN to help with this.

Read More

Predicting 2016-2017 NHL Season Results

Now to some new posts!

When making a prediction engine, it’s always fun to see what next season looks like. We have the schedule for the 2016-2017 NHL season, and we have all the data from the past seasons, so let’s get some calculations going!

Read More

Better Season Results Visualizations

In the past, we’ve Having a table of expected positions looks terrible. It’s hard to read, doesn’t fit in a page, and that much data is hard to absorb on the face of it.

Luckily, R has some great visualization tools in ggplot2. I’ll demonstrate some new ways to visuallize results, based on past posts’ predictions, and I’ll use these in future posts.

Read More

Evaluating the Models

Note: This is earlier work I did (last winter/spring) so some info may seem dated at time of posting. I’ve used data files current to then.

Last post we predicted the results of the remainder of the season. It’s exciting to know that your favourite team might make the playoffs, but how can you trust the model? We haven’t performed any validation so far. Maybe all the work we’ve done is a worse predictor than a 50/50 split of winners? Lets dive in and find out.

Read More

Simulating a Season

Note: This is earlier work I did (last winter/spring) so some info may seem dated at time of posting. I’ve used data files current to then.

Last time we predicted the score of a game using the time dependant Dixon-Coles method.

The interesting application of this is predicting how teams will do between now and the end of the season. One would really like to know if their team would make the playoffs or not. While no model can predict the impact of major trades, coaching changes, or other unforseen factors, they can do a very reasonable job at predicting what will happen if teams continue playing as they have been.

Read More

Dixon-Coles Prediction of a Single Hockey Game

## Error in optim(par = par.inits, fn = DCoptimFn, DCm = dcm, xi = xi, method = "BFGS", : non-finite finite-difference value [2]

Note: This is earlier work I did (last winter/spring) so some info may seem dated at time of posting. I’ve used data files current to then.

In section 1, we prepared historical hockey data for analysis. In section 2, we set up some functions do prepare the Dixon-Coles parameters. Now, we can use them to predict a game.

Read More

Dixon-Coles and Hockey Data

Note: This is earlier work I did (last winter/spring) so some info may seem dated at time of posting. I’ve used data files current to then.

Last entry we did some data importing and cleaning of historical NHL data, from 2005 to present. This was in anticipation of performing simulation of games, by the Dixon-Coles method. Much of this entry is not my original work, I’ve used slightly modified versions of the code available from Jonas at the opisthokonta.com blog. I’ve mixed his optimized Dixon-Coles method and the time regression method which was a key part of Dixon and Coles’ paper.

Read More

NHL Data Preparation

Note: This is earlier work I did (last winter/spring) so some info may seem dated at time of posting. I’ve used data files current to then.

Much work has been done on predicting winners of sports or games. Many different tools exist, including some that attempt to predict the score of games. Some are specific to a sport, such as the WASP tool for cricket, while others are simple and useful everywhere, like the log5 technique. Some use advanced individual statistics to sum up probabilities (see this pdf), and others use various statistical tools, such as Bayesian analysis.

Read More

Cleaning Hockey-Reference Data

Having downloaded data from Hockey-Reference.com in the last post, we’ll now want to prepare it for analysis. This will involve combining all of the files into one dataset, and doing some cleaning. Depending on our planned usage, we may wish to alter team names to provide continuity for moved teams (think Quebec Nordiques to Colorado Avalanche), or to isolate teams that have existed a few times (think about the Winnipeg Jets, or the Ottawa Senators).

Read More

Getting Data, Part One

Much of this blog will be focused on NHL data, as I mentioned in the opening post. There are two main sources for data about NHL hockey, from Hockey-Reference.com and from the R package nhlscrapr. This post we’ll focus on getting score data from Hockey-Reference from the start of the NHL to the present day.

Read More

Intro to Blog

Welcome to my blog! This will contain a mix of stuff, updated when I feel like it. Most of what will be here will be related to NHL hockey analyticss, or other programming projects in R, Python, or Java.

This is a chance for me to learn Jekyll, which is new to me.

I’ll start with some back-posts of work, so nothing ‘new’ will be here for a bit. For example, in Winter 2015-2016 I did some predictions on the remainder of the NHL season, obviously with fresh data that won’t be novel.

Hopefully this goes well!

Read More