NHL Stadium Locations
As part of the Data Science Specialization offered by John Hopkins through Coursera, I have a project to create an ‘interactive map’ in a rmarkdown post. I figured I should map where the NHL stadiums are.
We’ll start by downloading the locations of all of the stadiums. There’s a github with these locations. Although the data is possibly a bit out of date (Edmonton has a new stadium, for example), there is a list of locations available on github. We’ll download that, convert from JSON to a data frame, then plot them with leaflet, an R package wrapper of a javascript tool by the same name.
library(RCurl)
library(rjson)
url<-'https://raw.githubusercontent.com/nhlscorebot/arenas/master/teams.json'
rawjson<-getURL(url)
locations<-fromJSON(rawjson)
The locations aren’t laid out in a simple to process (or simple to convert to data frame) format, so we’ll clean the data a bit.
arenas<-data.frame('team'=names(locations))
uloc<-unlist(locations)
arenas$name<-uloc[seq(1, length(uloc), by=3)]
arenas$lat<-uloc[seq(2, length(uloc), by=3)]
arenas$lng<-uloc[seq(3, length(uloc), by=3)]
arenas$lat<-as.numeric(arenas$lat)
arenas$lng<-as.numeric(arenas$lng)
arenas$label<-paste0(arenas$team, ' - ', arenas$name)
With the data ready, we can build our map. It’s quite simple.
library(leaflet)
library(webshot)
mymap <- arenas %>%
    leaflet() %>%
    addTiles() %>%
    addMarkers(popup = arenas$label)
## Assuming 'lng' and 'lat' are longitude and latitude, respectivelymymap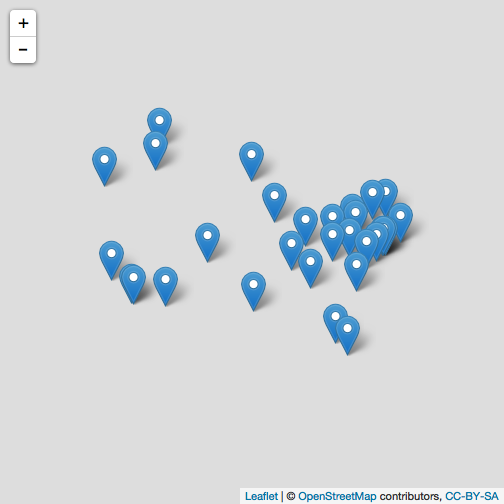
I’ll note, however, that getting leaflet maps to show on github pages is not easy. So you can view it on RPubs here: http://rpubs.com/pbulsink/arenamap.