Riddler 2017-08-04: Hot Potato
Hot Potato
From FiveThirtyEight’s riddler this week:
A class of 30 children is playing a game where they all stand in a circle along with their teacher. The teacher is holding two things: a coin and a potato. The game progresses like this: The teacher tosses the coin. Whoever holds the potato passes it to the left if the coin comes up heads and to the right if the coin comes up tails. The game ends when every child except one has held the potato, and the one who hasn’t is declared the winner.
How do a child’s chances of winning change depending on where they are in the circle? In other words, what is each child’s win probability?
This seems like a good candidate for Simulation, so here we go: We’ll prep a list of the students and the teacher, counting the number of times each had the potato. Then we’ll start flipping a coin (selecting -1 or +1), and repeat until only one person hasn’t had the potato yet. We’ll also recort the max number of times someone had the potato
We’ll reset and do it all again
wins<-rep(0, 31)
max_potato<-0
reps<-100000
for(i in 1:reps){
    #Prep the classroom
    classroom<-as.list(c(1, rep(0, 30)))
    names(classroom)<-c('teacher', paste0('student_',1:30))

    potato_position<-1
    winner <- NULL
    while(is.null(winner)){
        move<-sample(c(-1,1), size=1)

        if(potato_position == 1 & move == -1){
            potato_position <- 31
        }else if(potato_position == 31 & move == 1){
            potato_position <- 1
        }
        else{
            potato_position <- potato_position + move
        }

        classroom[[potato_position]] <- classroom[[potato_position]]+1

        if(length(classroom[classroom == 0]) == 1){
            winner<-which(classroom == 0)
        }
    }
    wins[winner]<-wins[winner]+1
    if(max_potato<max(unlist(classroom))){
        max_potato<-max(unlist(classroom))
    }
}
So, after 105 repeats, the max anyone had the potato was 206 times. And, we can look at a distribution of number of wins for each student with a quick and dirty plot:
plot(wins,
     xlab = 'Student',
     ylab = 'Wins',
     main = 'Wins per Student')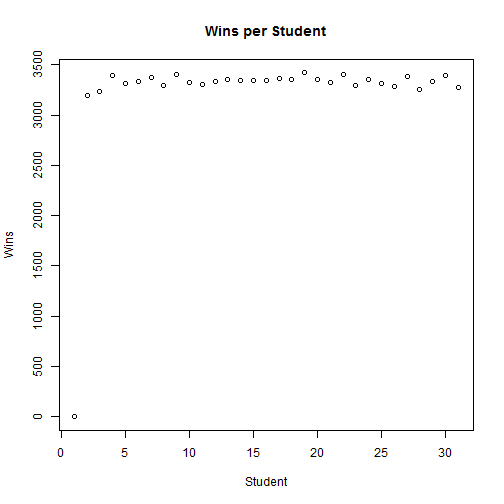
Simply put, no one won more than any other. With an even coin toss, you’re just as likely to win standing to the right of the teacher (at spot 2), with 0.03193 odds of winning, as you are when across the circle at spot 16, with 0.03346. Note, both of these are subject to simulation noise, but should be close to 1/30 (=0.0333).
Cool stuff.